Garmin Weekly Summary | A UX Case Study
PROJECT SCOPE
Class assignment for 8-week Prototyping class
ROLE/TEAM
UX Designer & Researcher
TOOLS
Figma
Sketch
Google Slides
Background
As an avid trail runner, my Garmin watch has been a trusted companion. Its long battery life, integrated GPS, and detailed pace and distance data make it irreplaceable. Garmin's mobile app, Garmin Connect, is rather disappointing.
The Problem
The Garmin Connect App unnecessarily complicates viewing activity data on a weekly basis. The limited information provided by the "Last 7 Days" feature hinders athletes from making informed training decisions week-to-week.
The Solution
A ‘Weekly Summary’ feature that includes all the data an athlete needs to know in order to make informed, data-driven training decisions.


Discover & Define
While I faced issues with Garmin Connect's weekly tracking capabilities, I needed to find out if others shared my experience. I consulted my local running community and found unanimous agreement among Garmin users. Many runners rely on third-party apps to effectively track and analyze their training due to the insufficient features offered by Garmin Connect.

“ I never use Garmin Connect to track my training week-to-week because it has everything too spread out. I use Runalyze.”
- Steph

“I try to use Garmin Connect to gauge my training in the last week but it’s complicated so I just don’t do it.”
- Emilio
Ideate & Brainstorm
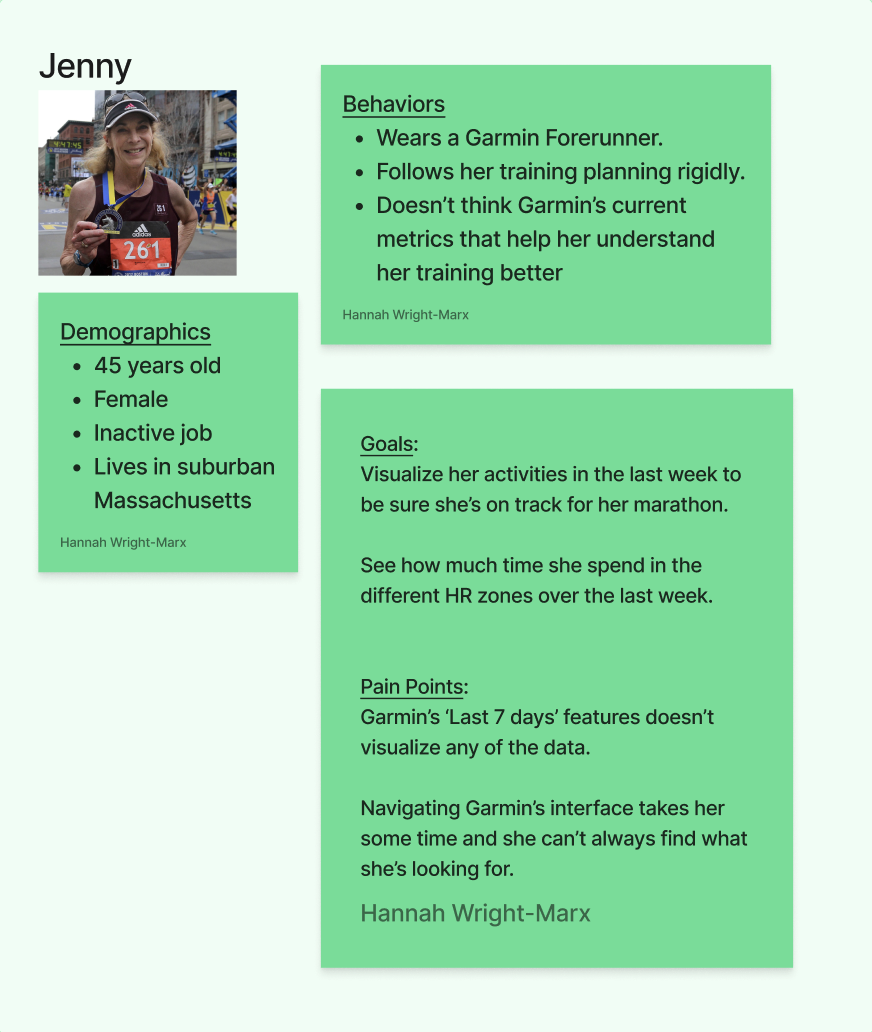
Proto-Persona
With the need for a Weekly Summary feature confirmed I began my ideation process and developed two multifaceted proto-personas named Richie and Jenny .

User Story & Journey


Weekly Summary Data Requirements
What kind of information did athletes need to see in a Weekly Survey? What information would allow them to best gauge their training? How could I visualize that data to give the athlete meaningful insights?
To solve these questions I did a lot of googling on what are the best metrics to judge your training by and started outlining what the metric cards might look like within the Weekly Summary Feature

Example of an article I read in order to try and gain insight into what metrics to include in the Weekly Summary

A screenshot of my ideation phase in Figma, trying to decide what the metrics cards in the Weekly Summary would look like.
Interactive Prototype
After wireframing I built an interactive prototype that allowed my ideas to really come to life. I wanted the prototype integrate seamlessly with the Garmin Connect app.

Wireframe & Protoype
Design System

Wireframes
Exploring the visual design through wireframing is an important part of my process. I use this step in my design process to feel out what level of data should be a priority, which information should be presented to the user first, etc.


Testing & Analysis
User Testing: Qualitative Approach
With my prototype where I wanted it, I wrote a user testing script and conducted a first round of user testing with five Garmin users. For this first found of user testing I focused on a qualitative approach and my interviews were conversational. I wanted to understand if the metrics (heart rate, running, calories, etc) where sufficient to help inform training decisions week-to-week, if the graphs and visualizations were clear and if the user was able to interact with my prototype easily.
User Feedback
- Graphs needed axis labels
- Weekly Summary makes it much easier to track training on a weekly basis
- Design is consistent with Garmin Connect look and feel
- A monthly in addition to weekly view would help with training decisions
- Broaden scope of weekly summary from runner focused to athlete focused
- Metrics are relevant to what information athletes need to make training decisions.
Changed graph design to make it easier to see when step goal was met.
“This makes tracking my running so much easier! I might actually use the Garmin app if it had this feature”
- Steph
Examples of updates implemented after testing…

Updated graph with green goal bar overlay

Monthly graph added for activities
Added a monthly graph view into activities cards.

Days and dates added to x-axes
User Testing: Quantitative Approach
During this user testing, users completed four tasks using the Weekly Summary Prototype and the Garmin Connect. After each task, I collected feedback through the SEQ (Single Ease Question). Once the tasks were finished, users filled out SUS questions and provided a final NPS (Net Promoter Score).
Below are the results for both the Weekly Summary Prototype and the Garmin Connect App.
SEQ Scores by Task - Weekly Summary Prototype
1 - Very Easy
7 - Very Difficult

Added days and dates to x-axis labels.
Mean Completion Rate (%) by Task

Task 1: “Can you tell me how many miles you ran on Wednesday of last week?”
Task 2: “Can you describe any trends in your running training in the last month?”
Task 3: “How many active calories did you burn on Monday of last week?”
Task 4: “How many days did you hit your step goal last week?”
Mean SEQ Score by Task

1 - Very Easy
7 - Very Difficult
SUS (System Usability Scale)
SUS represents the System Usability Scale and was initially formulated by John Brooke in 1986. It has become an industry standard for measuring usability of websites.
Q1 - I think that I would like to use this system frequently.
Q2 - I found the system unnecessarily complex.
Q3 - I thought the system was easy to use.
Q4 - I think that I would need the support of a technical person to be able to use this system.
Q5 - I found the various functions in this system were well integrated.
Q6 - I thought there was too much inconsistency in this system.
Q7 - I would imagine that most people would learn to use this system very quickly.
Q8 - I found the system very cumbersome to use.
Q9 - I felt very confident using the system.
Q10 - I needed to learn a lot of things before I could get going with this system.
SUS Score Matrix

Mean SUS Score by User
Analysis Summary
The proof is in the pudding/qualitative and quantitative data!
The Weekly Summary Prototype allowed users to track their training week-to-week easily and provided a much better user experience than the Garmin Connect overall.

Final Prototype Design & Reflection
I’m very pleased with how my final prototype turned out. I have a few thoughts about moving forward.
First, if Garmin were to implement a Weekly Study feature they should strongly consider building out relevant algorithms and data visualizations in order to compete with the 3rd party apps people are using.
Second, I would interview more cyclists, swimmers and climbers to see if there is data the Weekly Summary is missing for those sports.
Lastly, there are certain features I didn’t re-design because I wanted to be consistent with the look and feel of Garmin Connect. One feature I would re-design is the Goal Meter on the Activity Card. No one understands what it is!
Thanks for reading and happy adventuring!